Exhibit 6-14 Cost curves
?
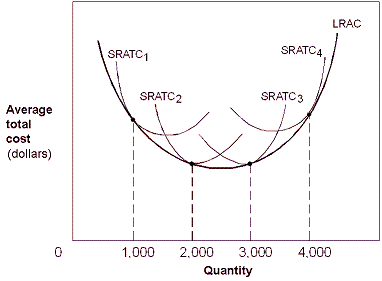
In Exhibit 6-14, the U-shaped LRAC curve indicates which of the following as quantity increases from 0 to 4,000?
A. Diseconomies of scale; constant returns to scale; economies of scale.
B. Constant returns to scale; economies of scale; diseconomies of scale.
C. Economies of scale; constant returns to scale; diseconomies of scale.
D. Economies of scale; diseconomies of scale; constant returns to scale.
Answer: C
You might also like to view...
Perfectly competitive firms are earning economic profits at a market price of $6 and an average total cost of $5. If new firms enter and increase the average total cost for all firms, the market price will ________ until ________.
A) increase; it reaches the new higher average total cost B) fall; it reaches the new higher average total cost C) fall; it reaches the new lower average total cost D) increase; economic profits are equal to zero
Unemployment rises in ____, and falls in ____
a. peaks; troughs b. booms; recessions c. expansions; contractions d. contractions; expansions
Figure 10-9
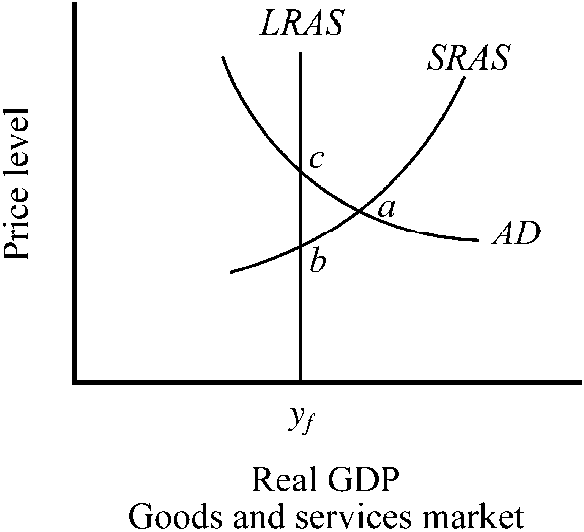
Currently, the economy depicted in is in
a.
long-run equilibrium at point b.
b.
short-run equilibrium at point c.
c.
long-run equilibrium at point a.
d.
short-run equilibrium at point a.
Refer to the graph shown. An increase in U.S. income would shift: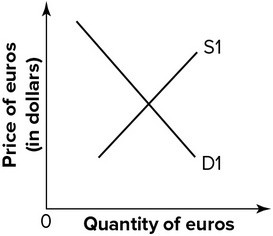
A. S1 left and cause the euro to gain value. B. S1 right and cause the euro to lose value. C. D1 left and cause the euro to lose value. D. D1 right and cause the euro to gain value.