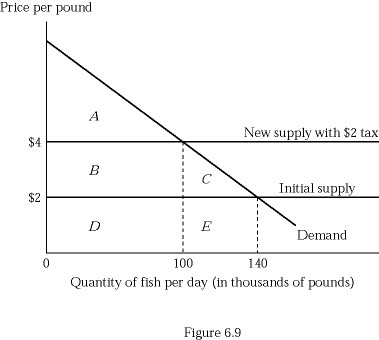
 Figure 6.9 depicts a hypothetical fish market with a horizontal supply curve. Suppose the government imposes a tax of $2 per pound of fish, and the tax is paid in legal terms by producers. Which of the following shows the extra money consumers must pay for the 100,000 pounds of fish they purchase?
A. Triangle A
B. Rectangle B
C. Triangle A + Rectangle B
D. Rectangle B + Triangle C
Answer: B
You might also like to view...
If the working-age population is 20 million and labor force is 13 million, the labor force participation rate is
A) 65 percent. B) 35 percent. C) 153 percent. D) 60 percent. E) impossible to calculate because data on the number of employed workers is needed.
Bill is a high-school dropout who lost his job in a fast food restaurant when the economy plunged into a recession. After 8 months, Bill is still looking for work. He is an example of
A) frictional unemployment. B) structural unemployment. C) cyclical unemployment. D) the natural unemployment rate.
To maximize expected profit, a perfectly competitive firm with a random marginal cost and known demand should produce at the level that sets ________ equal to ________.
A) marginal cost; marginal revenue B) expected marginal cost; marginal revenue C) expected marginal cost; expected marginal revenue D) marginal cost; expected marginal revenue
When studying how some event or policy affects a market, elasticity provides information on the
a. equity effects on the market by identifying the winners and losers. b. magnitude of the effect on the market. c. speed of adjustment of the market in response to the event or policy. d. number of market participants who are directly affected by the event or policy.