Parts (a), (b), and (c) of the figure below represent three graphs of the velocities of different objects moving in straight-line paths as functions of time. The possible accelerations of each object as functions of time are shown in parts (d), (e), and (f). Match each velocity vs. time graph with the acceleration vs. time graph that best describes the motion
3
You might also like to view...
Impulse: A super dart of mass 20 g, traveling at 350 m/s, strikes a steel plate at an angle of 30° with the plane of the plate, as shown in the figure. It bounces off the plate at the same angle but at a speed of 320 m/s. What is the magnitude of the impulse that the plate gives to the bullet?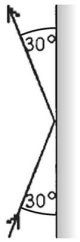
A. 0.52 N ? s B. 4.3 N ? s C. 300 N ? s D. 6.7 N ? s E. 0.30 N ? s
The precision and number of significant figures in 1.003 km is
A. precision = .0001 km, significant figure = 4. B. precision = .001 km, significant figure = 4. C. precision = .0001 km, significant figure = 3. D. precision = .001 km, significant figure = 3. E. precision = .0001 km, significant figure = 2.
Two equal charges Q are separated by a distance d. One of the charges is released and moves away from the other due to the force between them. When the moving charge is a distance 3d from the other charge, what is its kinetic energy?
What will be an ideal response?
What is the exosphere?
A) the lowest layer in the atmosphere B) the part of the atmosphere that absorbs optical light C) the part of the atmosphere that absorbs ultraviolet D) the part of the atmosphere in which the greenhouse effect is strongest E) the outermost, very low-density region of the atmosphere