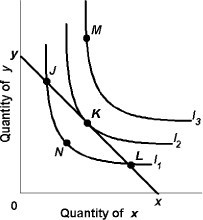
 Use the above figure. What does point N represent?
A. a consumer is spending more than her current income
B. a less satisfying point than compared to point J
C. a consumer not maximizing her satisfaction
D. a consumer maximizing her satisfaction
Answer: C
You might also like to view...
There has been a decrease in the demand for socks. This change can be shown graphically as a:
A. shift in the demand curve to the right. B. shift in the demand curve to the left. C. movement along the demand curve to the right. D. movement along the demand curve to the left.
Which resource generates the largest share of the income in the United States?
a. labor b. land c. capital d. entrepreneurial ability e. money
Which of the following scenarios fits these two graphs?
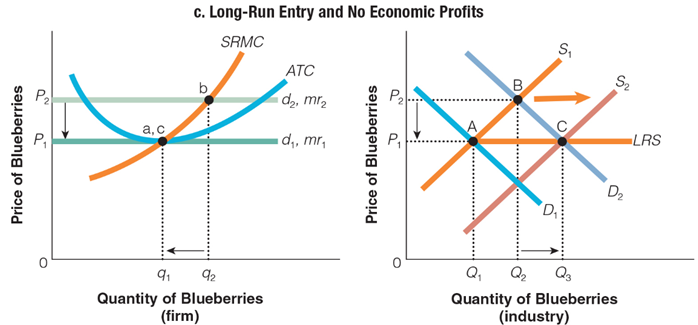
a. A farm continues to earn a profit as the market supply decreases, causing the market price to increase.
b. A farm’s economic profits return to zero as the market supply increases, causing the market price to decrease.
c. A farm’s profit plunges to a loss as the market supply decreases, causing the market price to increase.
d. A farm earns excess profits as the market supply increases, causing the market price to decrease.
The percentage of total national income spent on health care in the United States has
A) declined rapidly since 1965. B) remained below the level of inflation. C) risen steadily since 1965. D) remained constant over the last few years.