The following comparison line graph indicates the number of vehicles sold for a seven week period by two different salespeople. Use the graph to answer the question.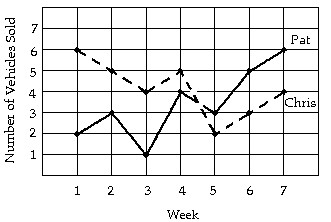 How many more vehicles did Chris sell in the third week than did Pat sell in the third week?
A. 1 vehicle
B. 2 vehicles
C. 3 vehicles
D. 4 vehicles
Answer: C
Mathematics
You might also like to view...
Find the amplitude, period or phase shift.Find the phase shift of y = -4 - 3sin .
.
A.  to the right
B.  to the left
C.  to the right
D.  to the left
Mathematics
Solve. Round all amounts to one decimal place.64 is 30% of what number?
A. 21.3 B. 19.2 C. 2133 D. 213.3
Mathematics
Find  if
if  .
?
.
?
A. 
B. 
C. 
D. 
E. 
Mathematics
Factor out the greatest common factor.9z - 45
A. 5(z - 9) B. 9(z - 45) C. 9(z + 5) D. 9(z - 5)
Mathematics