Use a graphing calculator to plot the data and find the quadratic function of best fit.The following data represents the total revenue, R (in dollars), received from selling x bicycles at Tunney's Bicycle Shop. Using a graphing utility, find the quadratic function of best fit using coefficients rounded to the nearest hundredth. 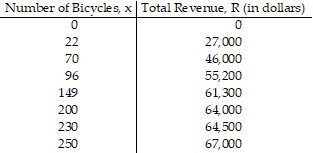
What will be an ideal response?
R(x) = -1.65x2 + 634.42x + 7089.93
You might also like to view...
Solve the problem.If a person puts one penny in a piggy bank on the first day, two pennies in on the second day, three pennies in on the third day, and so forth, how much money will be in the bank after 30 days?
A. $9.30 B. $0.30 C. $2.33 D. $4.65
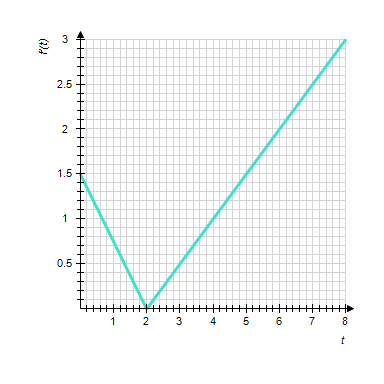
The graph of the derivative ? of
of  is shown. Compute the total change of
style="font-size:14.6667px;vertical-align:middle;" /> over the interval  .
.
?
?
?
A. 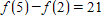
B. ?
C. ?
D. ?
E. ?
Solve the problem.A flare fired from the bottom of a gorge is visible only when the flare is above the rim. If it is fired with an initial velocity of 112 ft/sec, and the gorge is 192 ft deep, during what interval can the flare be seen? (h = -16t2 + vot + ho.)
A. 3 < t < 4 B. 0 < t < 3 C. 6 < t < 7 D. 9 < t < 10
Multiply.(x - 4)(7x2 + x + 9)
A. 7x3 + 27x2 + 5x - 36 B. 7x3 - 27x2 + 13x - 36 C. 7x3 - 29x2 + 5x - 36 D. 7x3 - 27x2 + 5x - 36