Use the data in the table to construct a line graph.The following table gives the bushels of rice shipped (in millions) from 1970 through 1976. Label the x-axis and y-axis for the time and the numerical value variables. 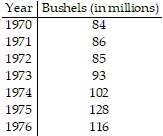
What will be an ideal response?
Answers may vary. One possible answer: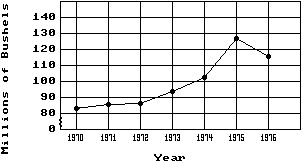
You might also like to view...
Find the domain of the given function f and find where it is increasing and decreasing, and also where it is concave upward and where it is concave downward. Identify all extreme values and points of inflection. Then sketch the graph of y = f(x). f(x) = e-x2/3
What will be an ideal response?
Simplify the expression. Use positive exponents. Assume variables represent nonnegative numbers.(-8x5)(-4x4)
A. -12x9 B. -32x20 C. 32x9 D. -12x20
Use the division method to find the GCF of the pair of numbers. If the GCF is 1, write "relatively prime."28 and 36
A. 4 B. 9 C. relatively prime D. 7
Find an equation of variation for the given situation.y varies jointly as x and z, and y = 111.51 when x = 5.9 and z = 9
A. y = 5.1xz
B. y = 
C. y = 2.1xz
D. y = 0.21xz