Figure 8-2
?
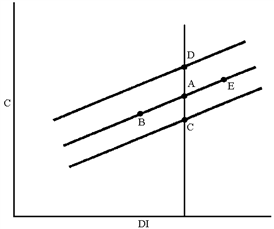
In Figure 8-2, which of the following moves can be explained by a tax cut?
A. A to B
B. A to C
C. A to D
D. A to E
Answer: D
You might also like to view...
The wage rate for high-skilled labor is higher than that for low-skilled labor because
A) both the demand for and the supply of high-skilled labor is greater than that for low-skilled labor. B) the demand for high-skilled labor is greater than the demand for low-skilled labor and the supply of high-skilled labor is less than the supply of low-skilled labor. C) the demand for high-skilled labor is less than the demand for low-skilled labor and the supply of high-skilled labor is greater than the supply of low-skilled labor. D) both the demand for and the supply of high-skilled labor is less than that for low-skilled labor.
The above figure shows an indifference map for a person's choices between leisure and consumption. Derive this person's labor supply curve for wage rates of $5, $10, and $15
What will be an ideal response?
The user cost of an exhaustible resource is
A) the same as its price. B) the same as its production cost. C) the opportunity cost of using the resource today rather than saving it for the future. D) the amount of the resource that is extracted today. E) not related to the amount of the resource that exists.
A downward shift in the consumption function can be caused by:
a. expectations of higher inflation. b. an increase in wealth. c. a lower price level. d. none of these.