Exhibit 1A-10 Multi-curve graph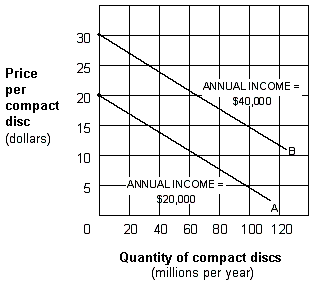
Exhibit 1A-10 represents a three-variable relationship. As the annual income of consumers rises from $20,000 (line A) to $40,000 (line B), the result is a:
A. rightward movement along each curve.
B. leftward movement along each curve.
C. leftward shift from curve B to curve A.
D. rightward shift from curve A to curve B.
Answer: D
You might also like to view...
Which of the following statements is TRUE about the difference between the public debt and the government budget deficit?
A) The public debt is a flow measure and the government budget deficit is not a flow measure. B) There is no relationship between the public debt and the government budget deficit since one is a stock measure and the other is a flow measure. C) The public debt always increases while the government budget deficit may increase or decrease. D) The public debt for this year will increase or decrease depending upon whether there is a government budget deficit or a government budget surplus.
Which of the following would reduce the labor force participation rate, all else equal?
A) an increase in the working-age population B) an increase in the unemployment rate C) a decrease in the unemployment rate D) an increase in the number of people in the labor force
Foreign direct investment refers to
A) the acquisition of more than 10 percent of the shares of ownership in a company in another nation. B) the acquisition of less than 10 percent of the shares of ownership in a company in another nation. C) the granting of a loan to a company located in a foreign country. D) a direct monetary grant to a foreign company or government.
Which of the following trade agreements, which took effect in 1994 and was implemented over a 15-year period, eliminates all tariffs and other trade barriers between its members?
A. North American Free Trade Agreement B. World Trade Organization C. Asian Pacific Economic Cooperation D. General Agreement on Tariffs and Trade