The line graph shows the recorded hourly temperatures in degrees Fahrenheit at an airport. 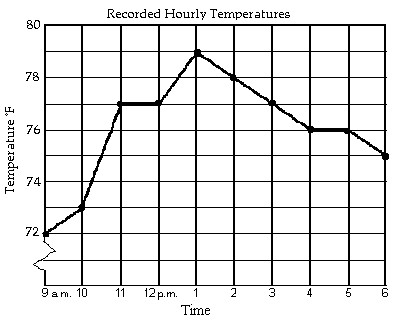 During which hour did the temperature increase the most?
A. 10 a.m. to 11 a.m.
B. 1 p.m. to 2 p.m.
C. 9 a.m. to 10 a.m.
D. 12 p.m. to 1 p.m.
Answer: A
You might also like to view...
Evaluate the given expression.
A. 110
B. 
C. 
D. 
Solve the problem.The function t(x) = -1.29x2 + 8.80x + 42.69 represents the temperature in Riversbend, IL from 11 P.M. on March 6, 2008 until 7 A.M. on March 7, 2008, where x is the number of hours after midnight on March 6, 2008. Determine the x-coordinate of the vertex of the graph of t(x). Then use this value in the function t(x) to estimate the maximum temperature. Round your answer for the vertex to the nearest hour. Round your answer for the temperature to the nearest degree.
A. x = 3.4; t = 57.6° B. x = 3; t = 58° C. x = -3; t = -2° D. x = 3; t = 68°
Solve the problem.The range R of a projectile is related to the initial velocity v and projection angle ? by the equation  where g is a constant. How is
  related to
  if ? is constant?
A.  =
= 

B.  =
= 

C.  =
= 

D.  =
= 

Solve.From a 24-inch by 24-inch piece of metal, squares are cut out of the four corners so that the sides can then be folded up to make a box. Let x represent the length of the sides of the squares, in inches, that are cut out. Express the volume of the box as a function of x. Graph the function and from the graph determine the value of x, to the nearest tenth of an inch, that will yield the maximum volume.
A. 3.7 inches B. 4.1 inches C. 3.8 inches D. 4.0 inches