Refer to Figure 3-7. Assume that the graphs in this figure represent the demand and supply curves for frozen yogurt. Which panel describes what happens in the market for frozen yogurt when the price of ice cream, a substitute product, increases?
A) Panel (a) B) Panel (b) C) Panel (c) D) Panel (d)
C
You might also like to view...
Suppose Cathy and Lewis work in a bakery making pies and cakes. Suppose it takes Cathy 1.5 hours to make a pie and 1 hour to make a cake, and suppose it takes Lewis 2 hours to make a pie and 1.5 hours to make a cake. Which of the following statements is correct?
A. Cathy has a comparative and absolute advantage in pies. B. Cathy has a comparative advantage in pies, and Lewis has an absolute advantage in pies. C. Lewis has a comparative and absolute advantage in pies. D. Lewis has a comparative advantage in pies, and Cathy has an absolute advantage in pies.
Price ceilings generally do not lead to which of the following?
A. Persistent shortages B. A reduction in the quality of the good C. An increase in the number of units purchased D. The development of black markets
Which of the following is included in both the balance of trade and the balance of payments?
A) exports B) earnings on domestic assets owned by foreign residents C) international capital movements D) earnings by domestic residents on assets located abroad
Based on the table showing poverty for different groups, the group with the highest poverty rate is ______.
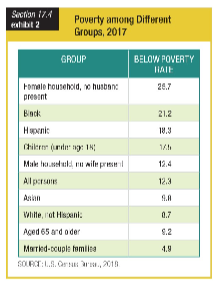
a. female households with no husband present
b. male households with no wife present
c. white, non-Hispanics
d. over 65 years old