Refer to the graph shown. Economic output in year 0 is $50 billion. What is potential output in year 3?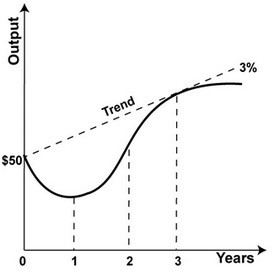
A. $54.6 billion
B. $50 billion
C. $47.0 billion
D. $56.3 billion
Answer: A
You might also like to view...
A public good:
A. is a good that is nonrival. B. is a good that is excludable. C. is any good provided by the government. D. All of these are true about public goods.
Refer to the above table. Suppose the price of Y rises from $18 to $20. What is the cross price elasticity of demand between X and Y?
A) -2 B) -1 C) 0 D) +1
Constant returns to scale indicate that a firm is experiencing:
a. per unit costs of production that are decreasing as the scale of output expands. b. per unit costs of production that do not vary with the scale of output c. per unit costs of production that are increasing as the scale of output expands. d. A decreasing marginal product.
Over the two decades leading up the 2008 crisis, ________ interest rates meant that consumers could take on ________ debt without significantly increasing the amount of debt service they had to pay.
A. falling; less B. falling; more C. rising; more D. rising; less