Determine from the graph whether the function has any absolute extreme values on the interval [a, b].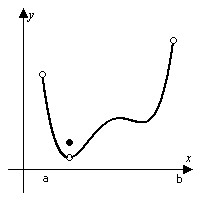
A. No absolute extrema.
B.
| Absolute minimum only. |
C. Absolute maximum only.
D. Absolute minimum and absolute maximum.
Answer: A
You might also like to view...
The population aged 65 years old and older (in millions) from 2000 to 2050 is projected to be
?


?
where  is measured in decades, with
  corresponding to 2000. What will be the average population aged 65 years and older over the years from 2000 to 2040?
(Hint: The average population is given by  . Multiply the integrand by
  and then use the method of substitution.) Please round your answer to one decimal place.
?
__________ million
Fill in the blank(s) with the appropriate word(s).
Find area of figure. Round to the nearest hundredth if necessary.Find the area of a rectangle measuring 5.8 yd by 21.41 yd.
A. 33.64 yd2 B. 248.356 yd2 C. 124.178 yd2 D. 27.21 yd2
Solve the problem. Round to the nearest cent.A computer is on sale for 20% off. If the discount amount is $313.04, then what is the initial price?
A. $2565.21 B. $3065.21 C. $1065.21 D. $1565.20
Find the vertex of the parabola.-2x2 + 4x - y - 6 = 0
A. 
B. (1, -4)
C. 
D. 