Refer to Figure 5.2. On the graph that shows total costs, what is the level of variable costs when 6 units are produced?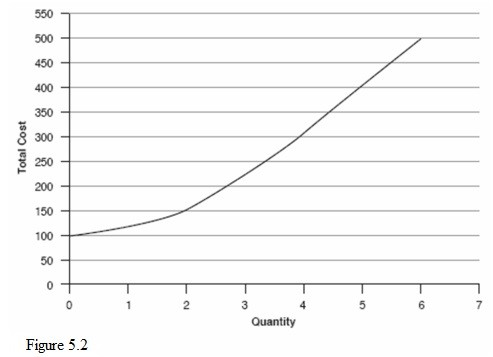
A. $400
B. $100
C. $500
D. $50
Answer: A
You might also like to view...
"Privatization of government owned industries is a more desirable way to operate an economy" is a ________ statement about ________ policy.
A. normative; monetary B. positive; structural C. normative; structural D. positive; fiscal
The principal cause of falling unemployment is ________
A) an increase in net entrants to the labor force B) a decrease in net entrants to the labor force C) an increase in the number of new jobs created D) a decrease in the number of jobs lost
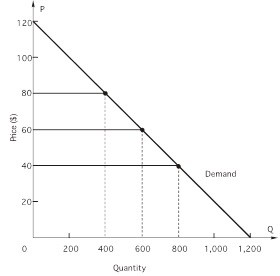 In the figure above, if price DECREASES from $80 to $60, an arrow representing the QUANTITY effect
A. will be shorter than (and in the same direction of) the arrow representing the price effect. B. will point in the opposite direction in which total revenue will move. C. will be shorter than (and in the opposite direction of) the arrow representing the price effect. D. will point upward. E. will point downward.
When the production of a good involves several inputs and inputs are used in fixed proportions, an increase in the cost of one input will usually cause total costs to
A) rise more than in proportion. B) rise less than in proportion. C) remain unchanged. D) rise by the exact amount of the input price increase.