Refer to the diagrams. The solid lines are production possibilities curves; the dashed lines are trading possibilities curves. The data suggest that:
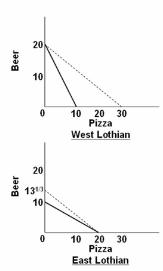
A. West Lothian should specialize in, and export, beer.
B. both countries will be better off if they do not engage in specialization and trade involving
these two products.
C. West Lothian should specialize in, and export, pizza.
D. East Lothian should specialize in, and export, beer.
A. West Lothian should specialize in, and export, beer.
You might also like to view...
Based on the model of the money market, if prices in the economy decrease, the equilibrium interest rate should
A) stay the same. B) increase. C) decrease. D) increase to the same extent that the supply of money increases.
Rent controls and the minimum wage are both examples of price ceilings
Indicate whether the statement is true or false
The amount of a good that must be given up to produce another good is the concept of:
A. scarcity. B. specialization. C. opportunity cost. D. efficiency.
The demand for good X has been estimated to be ln Qxd = 100 ? 2.5 ln PX + 4 ln PY + ln M. The cross-price elasticity of demand between goods X and Y is:
A. 4.0. B. ?2.5 percent. C. 4.0 percent. D. ?2.5.