Provide an appropriate response.Graph y = sin-1(sin x). Explain why the graph looks like it does.
What will be an ideal response?
When plugging in angles such that -  ? x ?
? x ?  the output is the same angle. However, the range of
 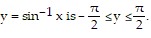 Therefore, when plugging in angles outside of that interval the output will be different. Instead of getting back the same angle you are getting back the first or fourth quadrant angle whose sine is the same value. The overall result is a function going back and forth between 1 and -1 in a linear fashion.
You might also like to view...
Find any values of the variable that make the expression undefined.
A. -2 B. 2, -2 C. 0 D. None
Find the area of the figure using determinants.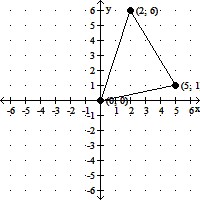
A. 14.5 B. 14.0 C. 13.5 D. 13.0
Use the graph of the equation ![]() shown below to identify the graph of one complete cycle of the equation
shown below to identify the graph of one complete cycle of the equation ![]() .
.
![]() ?
?
?
A. ?
![]()
?
B. ?
![]()
C. ?
![]()
D. ?
![]()
E. ?
![]()
Convert the units using unit fractions.390 sec =  min
min
A. 6
B. 23,400
C. 6
D. 3900