Use the figure below to answer the following question.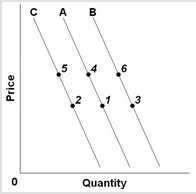 Refer to the three demand curves. An "increase in demand" would be illustrated as a change from
A. line A to C.
B. point 4 to point 1.
C. point 1 to point 2.
D. line C to B.
Answer: D
You might also like to view...
Risk that is common to all assets of a certain type is referred to as
A) systematic risk. B) unsystematic risk. C) idiosyncratic risk. D) structural risk.
If the marginal propensity to consume was 0.9, it would mean that:
A. consumers spend $9 out of every $10 of additional disposable income. B. consumers save $9 out of every $10 of additional disposable income. C. consumers spend $1 out of every $10 of additional disposable income. D. people should save more.
Market failure means that
A. the law of supply and demand has stopped functioning. B. resources are not allocated efficiently. C. the stock market has crashed. D. prices are no longer reliable indicators of how much things cost.
When one country can produce a given amount of a good using fewer inputs than any other country,
A. Specialization will definitely increase worldwide consumption possibilities. B. It always has a comparative advantage in producing the good. C. Specialization will definitely increase worldwide production possibilities. D. It has an absolute advantage in producing the good.