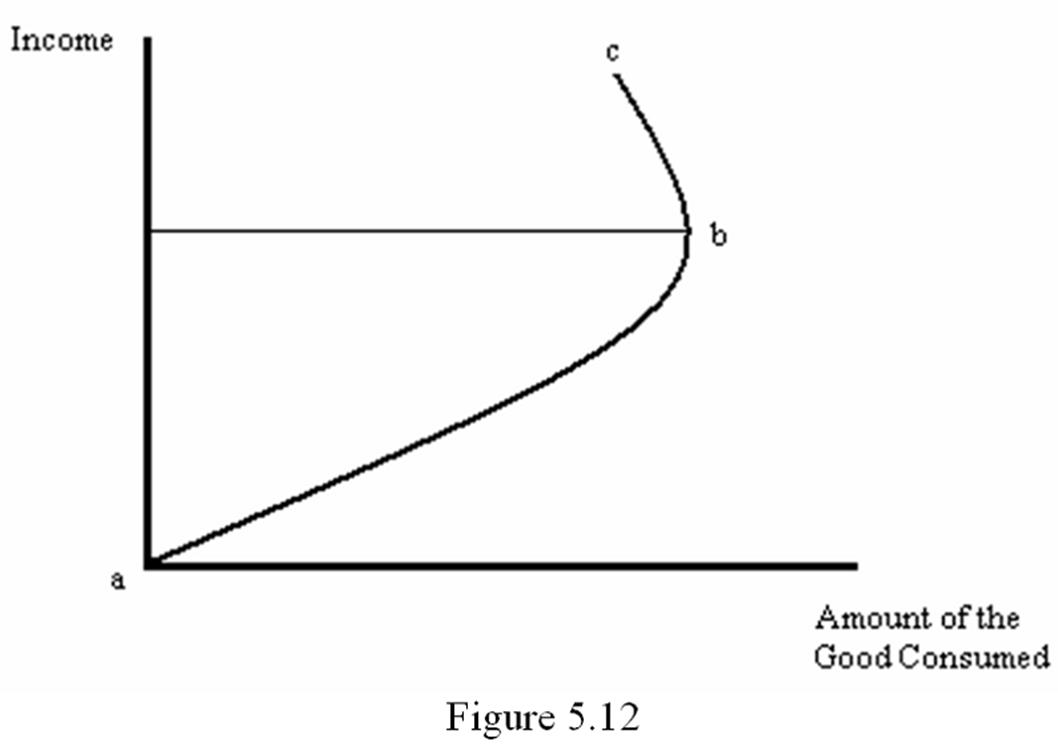
Using a carefully-labeled diagram, explain an Engel curve for a good that is initially a normal good, but eventually becomes an inferior good.
What will be an ideal response?
An Engel curve shows the relationship between income and the amount of a good consumed, holding everything else constant. If a good is normal, then an increase in income will cause more of the good to be consumed. Therefore, the Engel curve will be positively-sloped. This is shown by the segment labeled ab in Figure 5.12. If a good is inferior, then an increase in income will cause less of the good to be consumed, so the Engle curve is negatively-sloped. This is shown be the segment labeled bc in Figure 5.12.
You might also like to view...
The rate of return that households expect on their savings is determined by:
A) exchange rates. B) interest rates. C) government expenditure. D) tax rates.
Some sales managers are talking sho
A) "Since our competitors raised their prices our sales have doubled." B) "It has been an unusually mild winter; our sales of wool scarves are down from last year." C) "We decided to cut our prices, and the increase in our sales has been remarkable." D) none of the above
Are the goals of monetary policy in harmony or in conflict (a) in the long run and (b) in the short run?
What will be an ideal response?
By definition, a firm is
A. a business organization that consists of more than one person. B. an organization, whether private or public, that may or may not make a profit. C. a business organization that utilizes resources to produce goods or services with the goal of making a profit. D. a business organization that makes profits.