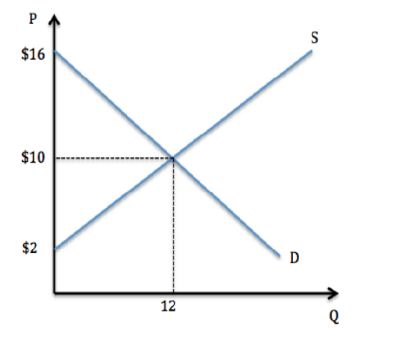
According to the graph shown, producer surplus is:
A. the area under the demand curve and above the market price.
B. the area under the supply curve and above the price.
C. the area above the supply curve and below the price.
D. the area above the demand curve and below the price.
C. the area above the supply curve and below the price.
You might also like to view...
Which of the following pairs of policies shift aggregate demand in the same direction? a. A tax increase and an increase in the money supply
b. A transfer payment decrease and an increase in the money supply. c. A reduction in government purchases and decline in the money supply. d. An increase in government purchases and a decline in the money supply.
Starting from long-run equilibrium, a decrease in autonomous investment results in ________ output in the short run and ________ output in the long run.
A. lower; potential B. higher; higher C. higher; potential D. lower; higher
If new legislation allowed patients to sue their health-maintenance organization (HMO), we would expect the supply curve for HMO-provided health care to shift to the right and the price of such coverage to fall
Indicate whether the statement is true or false
You have data for compensation of employees, proprietors' income, rental income, and net interest. Can you compute national income?
A) Yes, all of the components of national income are given. B) No, since data on indirect business taxes are missing. C) No, since data on corporate profits is missing. D) No, since data on the capital consumption allowance is missing. E) No, since net interest has not been adjusted for profits.