Graphically, economies to scale are illustrated by
A) a downward sloping long-run average cost curve.
B) a horizontal long-run average cost curve.
C) an upward sloping long-run average cost curve.
D) a long-run average cost curve that is shaped like an upside down U.
Answer: A
You might also like to view...
The natural rate of unemployment consists of frictional unemployment plus cyclical unemployment
Indicate whether the statement is true or false
Which economist(s) argued that high tax rates produce less tax revenues and limit the expansion of real GDP and employment?
a. Robert Lucas and Thomas Sargent b. A. W. Phillips c. Robert Barro d. Paul Samuelson e. Arthur LafferF
The change in the level of planned spending that results from a change in the price level is indicated by the movement of the economy along a given
a. aggregate expenditure curve. b. aggregate demand curve. c. aggregate supply curve. d. both aggregate expenditure curve and aggregate demand curve.
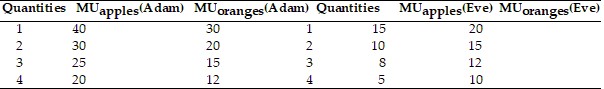 Use the above table. Adam has 3 apples and 3 oranges. Eve has 2 apples and 2 oranges. Eve asks Adam to give her an apple in exchange for an orange. Should Eve go through with this exchange?
A. No. Adam likes apples more than oranges. B. Yes. She is indifferent between consuming apples and oranges. C. Yes. This way she will have 3 apples, which will give her more total satisfaction. D. No. She gives up more satisfaction than she gets.