 Using Figure 1.3 and starting from PP1, an increase in the capacity to produce can be represented by a movement from
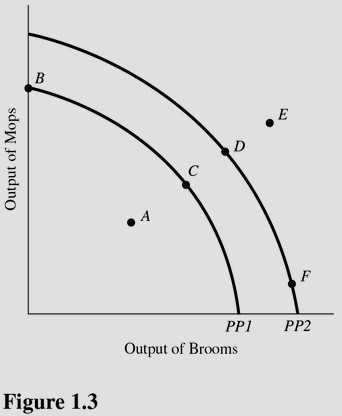
A. Point A to point C.
B. Point C to point F.
C. Point B to point C.
D. Point A to point B.
Answer: B
You might also like to view...
In 2006, real GDP in Belgium grew at a 3 percent rate and inflation was 1.8 percent while the population did not change. As a result, there was ________ demand for money curve in Belgium
A) a rightward shift of the B) a leftward shift of the C) a movement up along the D) no change in the
In an open economy, private saving, , is equal to
A) I - CA + (G - T). B) I + CA - (G - T). C) I + CA + (G - T). D) I - CA - (G - T). E) I + CA + (G + T).
Suppose that a labor union leader is trying to bargain for an increase in union workers' real wages of 5 percent. If he expected the price level to rise at a rate of 3 percent this year, how much would nominal wages need to increase for him to accomplish his objective?
a. 2 percent b. 3 percent c. 5 percent d. 8 percent e. 15 percent
The Laffer curve is based upon the idea that
A. the higher the tax rate the greater the tax receipts. B. high tax rates may yield less tax revenue than lower tax rates. C. the lower the tax rate the greater the tax receipts. D. income taxes are inefficient because tax reform has made it more difficult to legally avoid taxation.