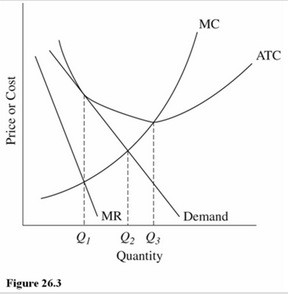
 Refer to Figure 26.3 for a monopolistically competitive firm in the long run. Which of the following observations results in the problem of excess capacity?
A. The firm is producing at Q3 instead of where MR = MC.
B. The firm is producing at Q1 instead of where MC = demand.
C. The firm is producing less than the minimum-ATC output rate.
D. The firm is earning only zero economic profits in the long run.
Answer: C
You might also like to view...
Suppose government spending decreases by $100 billion and the marginal propensity to consume (MPC) is 0.8. Given this information, this decrease in government spending will cause a(n)
A) increase in equilibrium real GDP equal to $500 billion. B) increase in equilibrium real GDP equal to $800 billion. C) decrease in equilibrium real GDP equal to $800 billion. D) decrease in equilibrium real GDP equal to $500 billion.
The figure above shows a perfectly competitive firm. The firm will shut down in the short run if total fixed costs
A) are between $201 and $400. B) exceed $401. C) are less than $200. D) exceed total costs.
The curve that represents all possible combinations of goods that can be produced is called
A) the production possibilities curve. B) the resource allocation curve. C) the efficiency curve. D) the supply curve.
What is the largest possible loss that is consistent with a firm producing in a perfectly competitive market in long-run competitive equilibrium?
a. An amount equal to (price less average variable cost). b. An amount equal to total variable. c. Zero. d. An amount equal to total fixed cost.