Use the following graph to answer the next question. 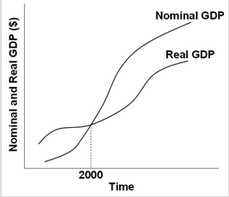 Which of the following statements is correct on the basis of the information shown?
A. The GDP price index equals 100 in 2000.
B. The GDP price index is less than 100 in 2010
C. The GDP price index is greater than 100 in 1990.
D. Without additional data, the value of the GDP price index cannot be known for any year in the graph above.
Answer: A
You might also like to view...
Most American workers
A. are employed in the goods-producing sector. B. are employed by government. C. are employed in the service-producing sector. D. are employed in the agricultural sector.
The Bureau of Labor Statistics (BLS) includes discouraged workers in its measure of the labor force
Indicate whether the statement is true or false
Sam has two jobs, one for the winter and one for the summer. In the winter, he works as a lift attendant at a ski resort where he earns $13 per hour. During the summer, he drives a tour bus around the ski resort, earning $11 per hour. Assume that Sam has an upward-sloping labor supply curve. If the opportunity cost of Sam's leisure time increases, he will respond by working
a. more hours. b. fewer hours. c. an equal number of hours. d. a number of hours that cannot be determined from the information. The labor demand curve is needed to make this determination.
The specification of the maximum amounts of commodities which may be imported into a country in any period of time is a:
Tariff Quota Nontariff barrier Voluntary export restriction