The consumer price data can be modeled by the function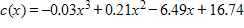 , where
 represents 1945 and
![]()
src="https://sciemce.com/media/3/ppg__cognero__Chapter_10_Applications_of_Derivatives__media__d92f0c51-12f7-4967-b384-efd5f2489b49.PNG" style="vertical-align:middle;" />is the consumer price index (CPI) in year . During what year does the model predict that the rate of change of the CPI reached its maximum?
?
A. 1955
B. 1981
C. 1996
D. 1977
E. 1947
Answer: E
You might also like to view...
Identify the variable as either qualitative or quantitative.The area of apartments in a city
A. Qualitative B. Quantitative
Determine whether the graph of the equation or function has symmetry about the x-axis, the y-axis, and the origin.f(x) = -6x3 + 3x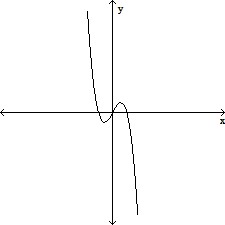
A. x-axis B. Origin C. x-axis, y-axis D. x-axis, origin
Use the rules for exponents to rewrite the expression and then evaluate the new expression. 
A. 
B. -4
C. 2
D. - 
Give the genus of the object. If the object has a genus larger than 5, write "larger than 5."A fly swatter
A. genus 1 B. genus 0 C. larger than 5 D. genus 2