Graphically, producer surplus is the area under the
A) demand curve and above the supply curve, up to the relevant quantity.
B) price and above the demand curve, up to the relevant quantity.
C) price and above the supply curve, up to the relevant quantity.
D) price and above the quantity axis, up to the relevant quantity.
E) demand curve and above the price, up to the relevant quantity.
C
You might also like to view...
When a market is efficient, the
A) sum of consumer surplus and producer surplus is maximized. B) deadweight gain is maximized. C) quantity produced is maximized. D) marginal benefit of the last unit produced exceeds the marginal cost by as much as possible. E) total benefit equals the total cost.
MacDougall compared export ratios and labor productivity ratios for the United States and the United Kingdom in order to test the
A) classical theory. B) the Heckscher-Ohlin theory. C) the Linder hypothesis. D) All of the above.
Which of the following is NOT a basic assumption of the "Lucas" model?
A) slow adjustment of wages and prices B) rational expectations C) imperfect information D) market-clearing
Based on the diagram, if potential output equals 5,000 and the real interest rate is 1 percent, then there is ________ gap and the Fed must ________ the real interest rate so that output will equal potential output. 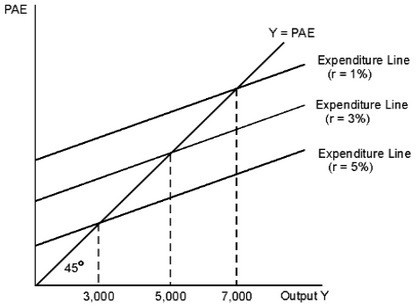
A. an expansionary; raise B. an expansionary; reduce C. a recessionary; raise D. a recessionary; reduce