The following graph shows average fixed costs, average variable costs, average total costs, and marginal costs of production.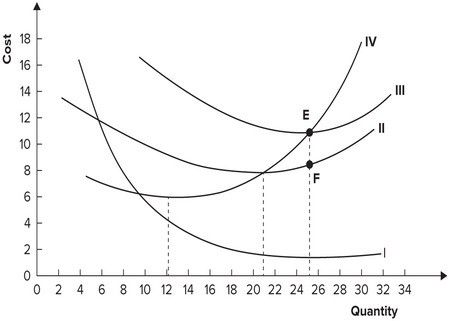 Average variable cost is minimized when output equals:
A. 21 units.
B. 25 units.
C. 12 units.
D. 6 units.
Answer: A
You might also like to view...
Refer to Figure 4-3. What area represents producer surplus at P2?
A) A + B + D B) B + D + G C) B + C + D + E D) B + D
When a firm’s fixed costs increase it should raise its prices in order to maximize profits.
Answer the following statement true (T) or false (F)
If a country increases its saving rate, which of the following permanently grow at a higher rate?
a. productivity and real GDP per person b. productivity but not real GDP per person c. real GDP per person but not productivity d. neither real GDP per person nor productivity
Debt instruments that have maturities less than one year are traded in the:
A. money market. B. primary market exclusively. C. bond markets exclusively. D. bond market if they are already in existence.