A biology class performs an experiment comparing the quantity of food consumed by a certain kind of moth with the quantity supplied. The model for the experimental data is given by
?
?
?
where x is the quantity (in milligrams) of food supplied and y is the quantity (in milligrams) of food consumed.
Select the correct graph of this model.
?
A. ?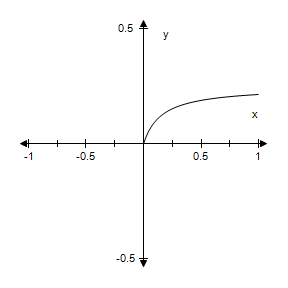
B. ?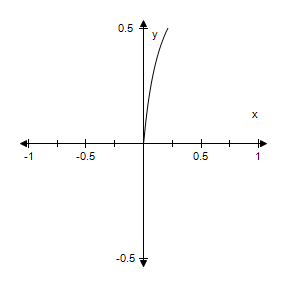
C. ?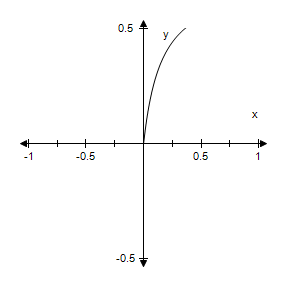
D. ?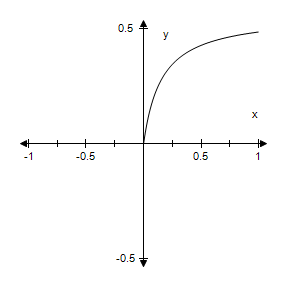
E. ? 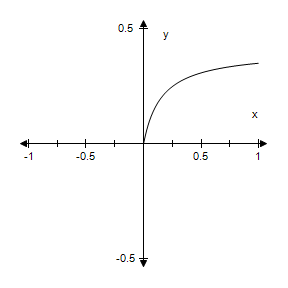
Answer: A
You might also like to view...
Suppose u and v are differentiable functions of x. Use the given values of the functions and their derivatives to find the value of the indicated derivative.u(2) = 10, u '(2) = 4, v(2) = -1, v '(2) = -5. (uv) at x = 2
A. -46 B. 54 C. -54 D. 45
Collect like terms.-9b + 4a + 4c + 2b + 7a
A. -3a - 7b + 4c B. 11a - 7b + 4c C. -7a + 11b + 4c D. 11a - 7b
Prepare a vertical analysis. Round percents to the nearest tenth of a percent. Rosie's Cleaning Service had a cost of goods sold of $44,000, operating expenses of $216,000, and net sales of $380,000.
A. Percent cost of goods sold = 11.6% Percent operating expenses = 68.4% B. Percent cost of goods sold = 68.4% Percent operating expenses = 11.6% C. Percent cost of goods sold = 56.8% Percent operating expenses = 11.6% D. Percent cost of goods sold = 11.6% Percent operating expenses = 56.8%
A geometric sequence is given. Find the common ratio and write out the first four terms.{dn} = 
A. r = 2; d1 =  , d2 =
  , d3 =
  , d4 =
B. r = 2; d1 =  , d2 =
  , d3 =
  , d4 =
C. r =  ; d1 =
  , d2 =
  , d3 =
  , d4 =
D. r =  ; d1 =
  , d2 =
  , d3 =
  , d4 =