The share of GDP taken by taxes has increased dramatically since the 1960s
a. True
b. False
Indicate whether the statement is true or false
False
You might also like to view...
Answer the next question based on the following payoff matrix for a duopoly in which the numbers indicate the profit in millions of dollars for each firm. Firm A? High PriceLow PriceFirm BHigh priceA = $250A = $325??B = $250B = $200?Low priceA = $200A = $175??B = $325B = $175If firm A adopts the high-price strategy, then firm B would adopt the
A. low-price strategy and earn $175. B. low-price strategy and earn $325. C. high-price strategy and earn $250. D. high-price strategy and earn $200.
Use the following graph, where Sd and Dd are the domestic supply and demand for a product and Pc is the world price of that product, to answer the next question.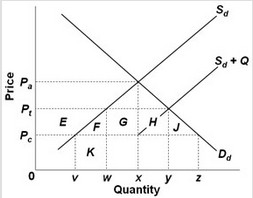 Sd + Q is the product supply curve after an import quota is imposed. A quota of y?w will result in a decrease of consumer surplus equal to area(s)
A. E. B. E + F + G + H + J. C. K. D. E + F +K.
The Fed can influence:
A. the budget of the federal government. B. the household savings rate. C. U.S. tax rates. D. the U.S. money supply.
When the price of fresh fish increases 10%, quantity demanded decreases 5%. The price elasticity of demand for fresh fish is ________ and total revenue from fresh fish sales will ________.
A. inelastic; decrease B. inelastic; increase C. elastic; decrease D. elastic; increase