The following graph shows the production possibilities curve for the economy with only two members, Silvia and Art. Silvia can produce either 50 pounds of beef or 2 computers per week, and Art can produce 100 pounds of beef or 1 computer per week. Both of them work 40 weeks per year.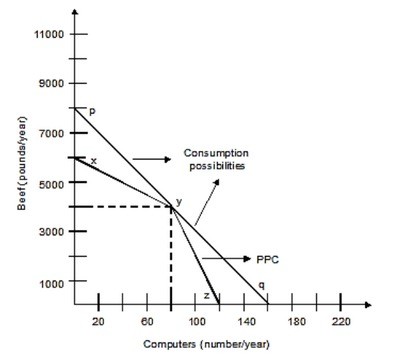 If both Art and Silvia worked full-time producing beef, how many pounds of beef can they produce per year?
A. 2,000 pounds
B. 4,000 pounds
C. 8,000 pounds
D. 6,000 pounds
Answer: D
You might also like to view...
To achieve long-run equilibrium in an economy with a recessionary gap, without the use of stabilization policy, the inflation rate must:
A. not change. B. increase. C. decrease. D. either increase or decrease depending on the relative shifts of AD and AS.
The original intent of the Federal Reserve Act of 1913 was to provide the Fed with what role?
A) regulator of the banking system B) lender of last resort C) manage the exchange rate D) maintain a balanced budget
Which of the following statements is correct?
a. The "law" of diminishing marginal utility implies that demand curves slope upward and to the right. b. If the price of a good falls, the utility-maximizing consumer will assure that marginal utility rises. c. If the price of a good falls, the consumer will purchase more of the good in order to maximize total utility. d. MU and demand have different underlying consumer behavior assumptions.
Refer to the data provided in Table 17.3 below to answer the following question(s). The table shows the relationship between income and utility for Terri.Table 17.3 IncomeTotal Utility $00$20,00010$40,00025$60,00045$80,00075Refer to Table 17.3. From the table, we can see that Terri is
A. risk-neutral. B. risk-averse. C. risk-loving. D. We cannot determine Jane's attitude toward risk from the table.