Use the following graph to answer the next question.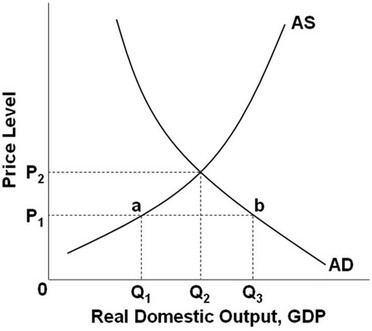 It depicts an economy in the ________.
A. current year
B. short run
C. current month
D. long run
Answer: B
You might also like to view...
Economists point out that the strong inflow of undocumented workers to some extent reflects the:
A. Increasing return to capital in the United States B. Increasing scarcity of unskilled labor in other countries C. More lenient immigration laws D. Increasing scarcity of domestic unskilled labor in the United States
The price of a given basket of goods in Year 1 was $1,300. The price of the same basket of goods in Year 2 was $1,560. The consumer price index for Year 2 taking Year 1 as the base year is ________
A) 120 B) 156 C) 100 D) 101
A firm's average total cost is $60, its average variable cost is $30, and its total fixed cost is $600. Its output is
A) 20 units. B) 30 units. C) 40 units. D) 50 units.
"Information problematic" borrowers must usually go the __________ finance route and issue __________ securities
A) direct; traded B) direct; nontraded C) indirect; traded D) indirect; nontraded