The circle graph below shows us how an average consumer spends money. Use this information to answer the question.  Suppose your family spent $47,000 on the items in the graph above. How much might we expect was spent on other?
A. $4700.00
B. $4112.50
C. $3525.00
D. $2350.00
Answer: A
Mathematics
You might also like to view...
Factor completely.x2 + 3xy - 10y2
A. (x - y)(x + 2y) B. (x + 5y)(x - 2y) C. (x - 5y)(x + y) D. (x - 5y)(x + 2y)
Mathematics
Find the first five terms of the sequence defined by the given general term.an = 
A.  ,
,  ,
,  ,
,  ,
, 
B.  ,
,  ,
,  ,
,  ,
, 
C. 1,  ,
,  ,
,  ,
, 
D. 1,  ,
,  ,
,  ,
, 
Mathematics
The bar graph shows the number of tickets sold each week by the garden club for their annual flower show.?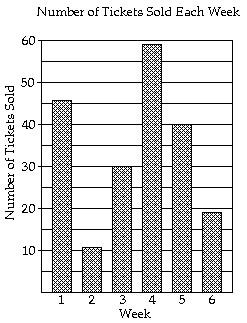 During which week did the garden club sell the fewest tickets?
A. week 2 B. week 4 C. week 5 D. week 6
Mathematics
Given the technology matrix A, and an external demand vector B, find the production vector X.
?
? ,
, 
What will be an ideal response?
Mathematics