Solve the problem.Suppose that the speed of a car, measured in miles per hour (mph), is monitored for some short period of time after the driver applies the brakes. The following table and graph relate the speed of the car to the amount of time, measured in seconds (sec), elapsed from the moment that the brakes are applied.
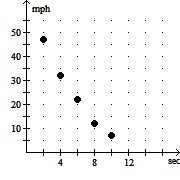 What general trend do the data reflect? In which of the time intervals does the speed change the most?
A. With increasing elapsed time, the speed decreases. The speed changes most during the time interval from 8 seconds to 10 seconds.
B. With increasing elapsed time, the speed decreases. The speed changes most during the time interval from 2 seconds to 4 seconds.
C. With increasing elapsed time, the speed increases. The speed changes most during the time interval from 8 seconds to 10 seconds.
D. With increasing elapsed time, the speed increases. The speed changes most during the time interval from 2 seconds to 4 seconds.
Answer: B
You might also like to view...
Solve the formula for the specified variable.P = 2L + 2W; for W
A. W = P - L
B. W = d - 2L
C. W = 
D. W = 
Determine whether the graph is the graph of a function.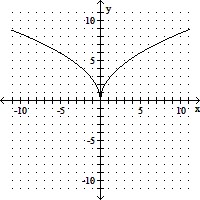
A. yes B. no
Provide an appropriate response.Find the perimeter of the given figure:
A. 54 m2 B. 27 m C. 54 m D. 176 m
Solve the problem.County records list a rectangular parcel of land as measuring 30,429 square yards. A surveyor measures the length of the parcel of land as 207 yards. What is the width of the parcel?
A. 30,222 yards B. 147 yards C. 156 yards D. 140 yards