Graph the linear inequality.x ? 2
A. 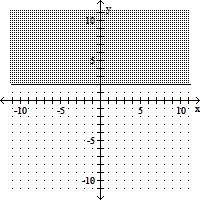
B. 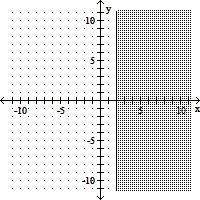
C. 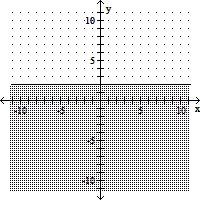
D. 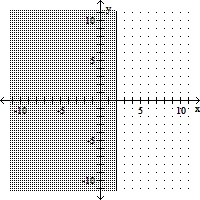
Answer: B
You might also like to view...
Fill in the blank with one of the words or phrases listed below. The symbol
  means is less than.
A. equivalent B. like C. > D. <
Solve the problem.A study was conducted to compare the average time spent in the lab each week versus course grade for computer students. The results are recorded in the table below. By using linear regression, the following equation is obtained:  where x is the number of hours spent in the lab and y is grade on the test. Use this equation to predict the grade of a student who spends 8 hours in the lab. Number of hours spent in lab Grade (percent) 10 96 11 51 16 62 9 58 7 89 15 81 16 46 10 51
A. 80.6 B. 73.7 C. 69.7 D. 75.3
Draw a graph of the rose curve.r = 2 sin 3?, 0 ? ? ? 2?
A. 
[-2, 2] by [-2, 2]
B. 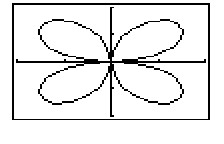
[-2, 2] by [-2, 2]
C. 
[-2, 2] by [-2, 2]
D. 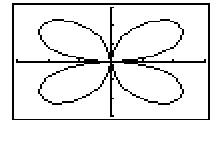
[-2, 2] by [-2, 2]
Find the x-intercept of the linear equation x+ y- 4= 0.
What will be an ideal response?