Solve the problem.The circle graph shows the fraction of books read by students in grades one through five. What fraction of books was read by students in fourth and third grades combined?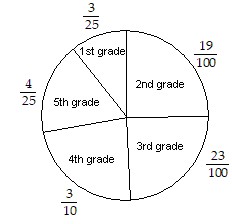
A.  of books
B.  of books
C.  of books
D.  of books
Answer: D
Mathematics
You might also like to view...
Sketch the graph and show all local extrema and inflection points.y = ln (10 - x2)
A. Local minimum (0, ln 10)
No inflection point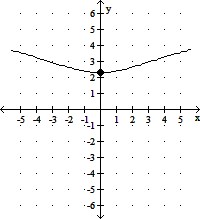
B. Local maximum (0, ln 10)
No inflection point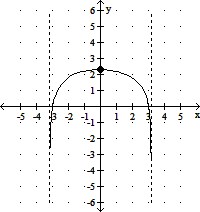
C. No extrema
No inflection point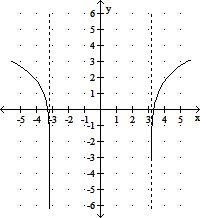
D. Local minimum (0, -ln 10)
No inflection point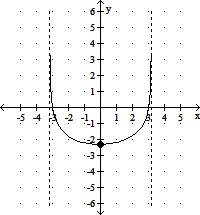
Mathematics
The scores on a 30-point multiple-choice exam are given in the following frequency table:
 The interquartile range on the exam is
A. 4. B. 2.5. C. 3.5. D. 3. E. none of these
Mathematics
Identify the intersection of the plane with the solid.Square pyramid
A. Triangle
B. Quadrilateral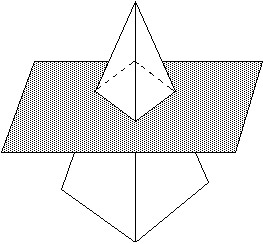
Mathematics
Solve the equation
?
 ?
?
A. 
B. 
C. 
D. 
E. 
Mathematics