Graphically, a change in price causes:
A. a movement along a given supply curve, not a shift.
B. the demand curve to shift.
C. both supply and demand to shift.
D. the supply curve to shift.
Answer: A
You might also like to view...
In the Keynesian model, it is assumed that, when demand for a firm's product changes, the firm:
A. changes prices and production levels to meet demand. B. changes prices to meet the demand. C. changes production levels to meet the demand. D. changes prices, but holds production levels constant, to meet the demand.
Refer to Figure 2-4. Unemployment could cause this economy to produce at which point(s)?
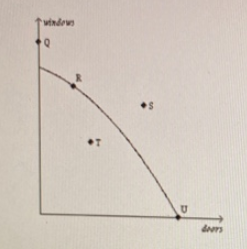
a. Q, S
b. Q, S, T
c. R, U
d. T
A firm will attain more monopoly power as demand for its product becomes more elastic.
a. true b. false
Graphically, economic growth is represented as
A. a movement along the production possibilities curve. B. a movement from a point inside the production possibilities curve to a point on the curve itself. C. an outward shift of the production possibilities curve. D. an inward shift of the production possibilities curve.