Solve the problem.The price per unit of a product is p and the number of units of the product is denoted by q. The demand function for this commodity is given by p =  . Describe the transformations needed to obtain the graph of this function from the graph of p =
  .
.
A. Shift up 60 units and stretch vertically by a factor of 4000.
B. Shift 60 units to the left and stretch vertically by a factor of 4000.
C. Shift 60 units to the right and stretch vertically by a factor of 4000.
D. Shift 60 units to the left and shift up 4000 units.
Answer: B
You might also like to view...
The line graph shows the recorded hourly temperatures in degrees Fahrenheit at an airport. Use the graph to answer the question.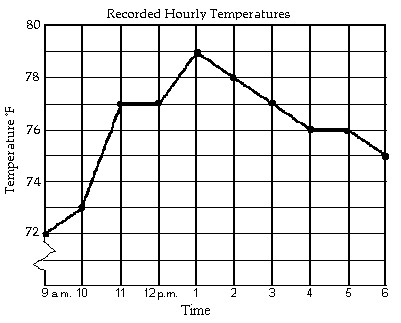 During which two-hour period did the temperature increase the most?
A. 10 a.m. to 12 p.m. B. 12 p.m. to 2 p.m. C. 10 a.m. to 11 a.m. D. 9 a.m. to 11 a.m.
Provide an appropriate response.The process of amortization includes which of the following?
A. a specific length of time B. equal payments C. variable rates D. both equal payments and a specific length of time
Perform the indicated operations.( 8x4 + 8x2 - 6x ) - ( -9x3 + 5x2 - 6x - 8)
A. 14x7 + 13x3 B. 8x4 + 9x3 + 3x2 + 8 C. 8x4 - 9x3 + 13x2 - 8 D. 9x4 + 10x3 + 13x2 + 8
Complete.0.798 mg =  mcg
mcg
A. 0.00798 B. 79.8 C. 0.000798 D. 798