Graph the function. Specify the intervals over which the function is increasing and the intervals where it is decreasing.y = -x4/3
A. Increasing -? < x < 0
Decreasing 0 < x < ?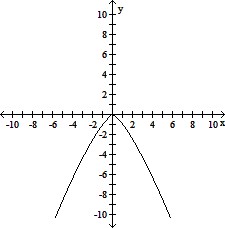
B. Decreasing -? < x ? 0
Increasing 0 ? x < ?
C. Decreasing -? < x < ?
D. Increasing -? < x < ?
Answer: A
You might also like to view...
Find the total area of the region between the curve and the x-axis.y = (x + 4)3; 0 ? x ? 1
A. 
B. 369
C. 
D. 27
Use the figure to answer the question.The following scatterplot shows the heights (in inches) of a group of children and their ages. 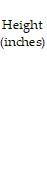

 Age (years)What can be the expected height range for a 2-year-old child?
A. 35-45 inches B. 40-50 inches C. 20-30 inches D. 25-38 inches
Solve the problem. Round your answer to the nearest tenth, when appropriate. Use the formula  , as needed.Find the pH if [H3O+] = 7.7 × 10⁻⁵.
A. 5.9 B. 4.1 C. -5.9 D. 4.6
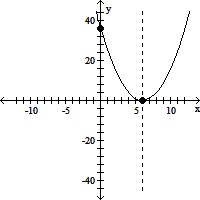
Graph the quadratic function using its vertex, axis of symmetry, and intercepts.f(x) = x2 + 12x + 36
A. vertex (-6, 36)
intercept (0, 72)
B. vertex (-6, 0)
intercepts (0, 36), (-6, 0)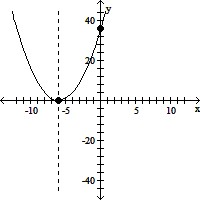
C. vertex (6, 36)
intercept (0, 72)
D. vertex (6, 0)
intercepts (0, 36), (6, 0)