Exhibit 4-8 Demand and supply curves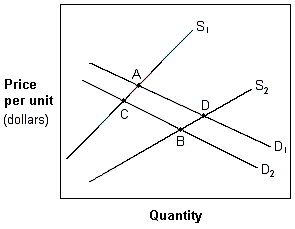
In Exhibit 4-8, a movement from A to B in which price has decreased and quantity has increased is best explained by a(n):
A. increase in supply and demand.
B. decrease in supply and demand.
C. increase in supply that dominates a decrease in demand.
D. increase in demand that dominates a decrease supply.
Answer: C
You might also like to view...
Which of the following is TRUE of the relationship between U.S. trade deficits and federal government budget deficits?
A) Increases in the budget deficit are always associated with reductions in the trade deficit. B) Increases in the budget deficit are always associated with increases in the trade deficit. C) Increases in the budget deficit tend to be associated with increases in the trade deficit. D) Increases in the budget deficit tend to be associated with reductions in the trade deficit.
Which antitrust act prohibits price fixing and other conspiracies and combinations that restrain trade and attempts to monopolize?
a. Sherman Antitrust Act of 1890. b. Clayton Act of 1914. c. Federal Trade Commission Act of 1914. d. Robinson-Patman Act of 1936. e. Cell-Kefauver Act of 1950.
Unexpected high inflation redistributes wealth from:
A. those who save to those who borrow. B. those who borrow to those who save. C. those who borrow to banks. D. banks to those who save.
Banks and mutual funds are examples of financial markets
a. True b. False Indicate whether the statement is true or false