The pie chart below shows the number of pizzas consumed by college students in a typical month. Use the chart to answer the question. 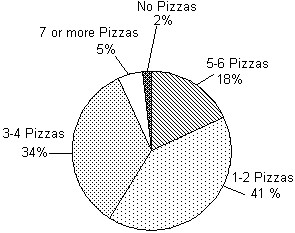 What percent of college students consume no pizzas in a typical month?
A. 5%
B. 34%
C. 2%
D. 18%
Answer: C
Mathematics
You might also like to view...
Draw and shade a part of a diagram to represent the figure. of a diagram
A. ![]()
B. ![]()
C. ![]()
D. ![]()
Mathematics
Provide an appropriate response.Describe two advantages of the substitution method over the graphing method for solving systems of equations.
What will be an ideal response?
Mathematics
Use the distributive property to rewrite the expression. Do not find the product.4(7 + 11)
A. 4 + 7 + 11 B. 4 ? 7 ? 11 C. 4 ? 7 + 4 ? 11 D. 4 ? 7 + 11
Mathematics
Simplify. -
- 
A. 
B. 
C. 
D. - 
Mathematics