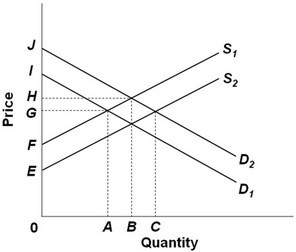
 Refer to the above supply and demand graph. Point A represents the current equilibrium level of output of this product and point B represents the optimal level of output from society's perspective. This supply and demand graph indicates that there is(are):
A. an overallocation of resources to the production of this product.
B. a negative externality from the production of this product.
C. spillover benefits to the production of this product.
D. spillover costs to the production of this product.
Answer: C
You might also like to view...
Suppose the current federal funds rate is 0.25% and the Fed chooses to raise its target to 0.5%. Make use of a graph of the federal funds market to show how it will use open market operations to accomplish this
What will be an ideal response?
The securities, such as stocks or bonds, constitute a(n) ________ for the savers and a(m) ________ for the borrowers
A) asset; liability B) debt; assets C) liability; asset D) debt or an asset; liability or an asset
A corporation with "plowback"
a. deliberately earns negative profit on some activities in order to get better tax treatment. b. buys back shares of its stock from shareholders. c. retains some of its earnings for investment. d. issues unsecured stock.
The first bankers were
A) sheriffs. B) goldsmiths. C) clergy. D) innkeepers. E) economists.