In this graph, output level RGDP2 is ______.
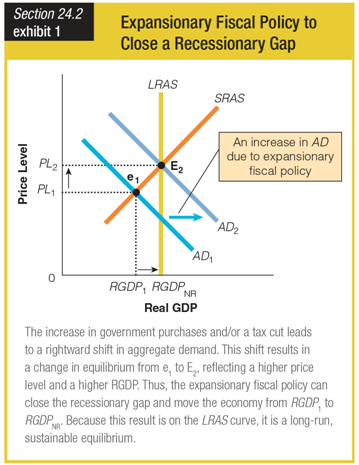
a. sustainable at equilibrium point E1
b. sustainable at equilibrium point e2
c. sustainable at equilibrium point E3
d. not sustainable at equilibrium points E1, e2, or E3
d. not sustainable at equilibrium points E1, e2, or E3
You might also like to view...
As more people quit smoking in the United States, what is expected to happen to the price elasticity of supply of cigarettes?
A) It will decrease. B) It will increase. C) It can increase or decrease. D) It will not change.
Winner's curse is likely to happen in which of the following auctions?
A) unexplored oil reserves B) corn stored in a warehouse C) 1,000 ton of iron ore D) U.S. Treasury Bonds
If technology improves when a nation is in the intermediate range and only the Aggregate Supply changes, then:
a. Real GDP rises and real GDP remains the same. b. Real GDP remains the same and average price level falls. c. Real GDP remains the same and average price level rises. d. Real GDP rises and average price level falls. e. Real GDP falls and average price level rises.
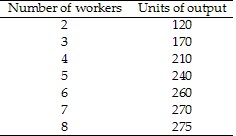
 Refer to Table 17.2. If the price of output is $2 per unit and we observe the firm hiring four workers, if the firm is maximizing profit, the wage rate must be between ________ and ________.
A. $25; $45 B. $30; $35 C. $45; $60 D. $60; $80