Use the graph to solve the problem.The graph depicts a relationship between scores achieved on an unspecified standardized test and family income. Find the rate of change of test scores with respect to family income.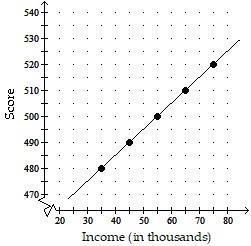
A. 1 point(s) per thousand dollars
B. 10.1 point(s) per thousand dollars
C. 1000 point(s) per thousand dollars
D. 100 point(s) per thousand dollars
Answer: A
Mathematics
You might also like to view...
Provide an appropriate response.True or false? 0 is an element of the rational numbers.
Fill in the blank(s) with the appropriate word(s).
Mathematics
Find the exact value of the expression.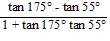
A. - 
B. -2
C. - 
D. -
Mathematics
Rationalize the denominator of the expression.
?
 ?
?
A. 
B. 
C. 
D. 
E. 
Mathematics
Multiply the polynomials using the special product formulas. Express the answer as a single polynomial in standard form.(7x + y)(7x - y)
A. 49x2 - 14xy - y2 B. 49x2 - y2 C. 14x2 - y2 D. 49x2 + 14xy - y2
Mathematics