Use the line graph to answer the question.The line graph shows the 2001 sales data for the Big "D" company. 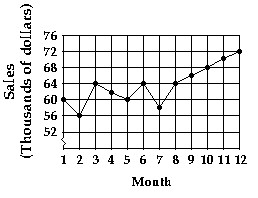 Which month had the highest sales?
A. Month 6
B. Month 8
C. Month 3
D. Month 12
Answer: D
You might also like to view...
Match the given equation with one of the graphs.x2 - y2 = 144
A. 
B. 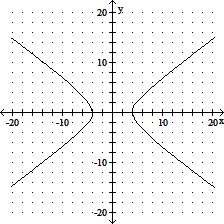
C. 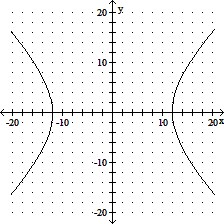
D. 
Find  for the given function.y =
A. - 
B. - 
C. 
D. - 
Find the coordinates of the centroid (to the nearest 0.01 in.) of the uniform flat-plate machine part shown.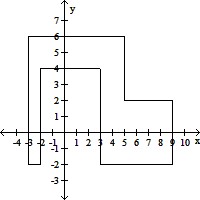
A. (3.22 in., 1.96 in.) B. (2.88 in., 1.75 in.) C. (3.22 in., 2.90 in.) D. (2.90 in., 1.64 in.)
Solve the problem.Linda invests src="https://sciemce.com/media/4/ppg__tttt0516191133__f1q124g6.jpg" alt="" style="vertical-align: -4.0px;" /> and  for one year. Part is invested at
  , another part at
  , and the rest at
  . The total income from all 3 investments is
  . The combined income from the
  investments is the same as the income from the
  investment. Find the amount invested at each rate.
A. $10,000 at 5%; $5000 at 6%; $10,000 at 8%
B. $8000 at 5%; $10,000 at 6%; $7000 at 8%
C. $5000 at 5%; $10,000 at 6%; $10,000 at 8%
D. $10,000 at 5%; $10,000 at 6%; $5000 at 8%