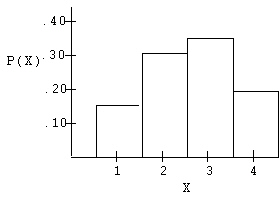
Draw the graph of the following probability distribution.
X

1
0.15
2
0.30
3
0.35
4
0.20
What will be an ideal response?
Mathematics
You might also like to view...
Solve the problem.Find the lateral surface area of a right circular cone with a radius of 55.3 cm and a slant height of 93.7 cm.
A. 25,900 cm2 B. 300,000 cm2 C. 16,300 cm2 D. 8140 cm2
Mathematics
Find the logarithm. Give an approximation to four decimal places.ln 14,800,000
A. 4.9972 B. 0.0604 C. 7.1703 D. 16.5101
Mathematics
Graph the function and estimate.Graph the function based on the table of values. Assume that the domain and range are all real numbers. After you have finished the graph, estimate the value of f(x) when x = 2.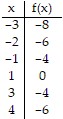
A. 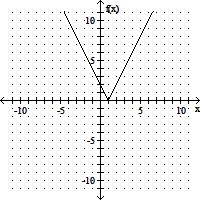
f(2) = 2
B. 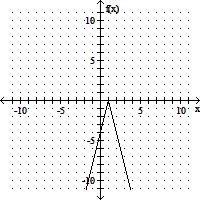
f(2) = -4
C. 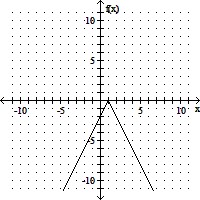
f(2) = -2
D. 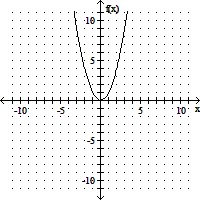
f(2) = 4
Mathematics
State precisely (but concisely) what it means for an integer n to be divisible by an integer d.
What will be an ideal response?
Mathematics