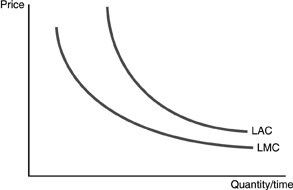
 Refer to the above figure. The long-run average cost curve and the long-run marginal cost curves represent
A. the cost curves for a natural monopoly.
B. a situation where a firm has control over the raw materials.
C. a situation where a firm has a patent.
D. the cost curves for a competitive firm.
Answer: A
You might also like to view...
Last week, six Swedish kronor could purchase one U.S. dollar. This week, it takes eight Swedish kronor to purchase one U.S. dollar. This change in the value of the dollar will ________ exports from the United States to Sweden and ________ U.S
aggregate demand. A) increase; increase B) decrease; increase C) increase; decrease D) decrease; decrease
If the value of a cable TV franchise is uncertain, too much may be bid for the franchise. This is an example of
a. moral hazard b. an authority relation c. the winner's curse d. the principal-agent problem e. adverse selection
In what decade did the U.S. government first decide to intervene in the farm economy?
a. 1950s b. 1930s c. 1970s d. 1960s e. 1980s
When the court requires evidence that a monopoly actually used its size to violate antitrust laws, this criterion is called
a. rule of reason b. Sherman antitrust c. per se d. countervailing power e. creative destruction