Refer to the graphs shown. The most tax revenue collected by a given per-unit tax on producers is shown by graphs: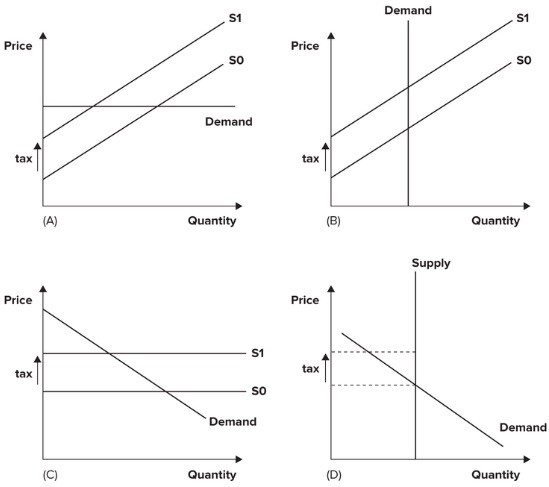
A. C and D.
B. B and C.
C. A and D.
D. B and D.
Answer: D
You might also like to view...
If the consumption function is defined as C = 5,500 + 0.9Y, what is the marginal propensity to consume?
A) 0.1 B) 0.9 C) 5.5 D) 6.1
Which of the following could be responsible for a decrease in the price of wheat?
a. an increase in the supply of wheat b. an increase in the demand for wheat c. a decrease in the demand for wheat d. Either a. or c. could decrease the rice of wheat.
Assuming the total population is 100 million, the civilian labor force is 50 million, and 47 million workers are employed, the unemployment rate is:
A. 3 percent. B. 6 percent. C. 7 percent. D. 53 percent.
In the long run, the Phillips curve will be ________ at the natural rate of unemployment if the long-run aggregate supply curve is vertical at potential output.
A. positively sloped B. vertical C. negatively sloped D. horizontal