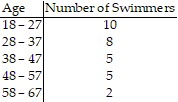
Use the data to construct a frequency distribution.The ages of 30 swimmers who participated in a swim meet are as follows:18, 36, 30, 33, 40, 18, 50, 59, 19, 43, 51, 19, 26, 28, 41, 20, 29, 20, 58, 49, 24, 37, 46, 53, 33, 22, 22, 41, 30, 49Construct a grouped frequency distribution for the data. Use the classes 


src="https://sciemce.com/media/4/ppg__rrrr0613190819__f1q110g5.jpg" alt="" style="vertical-align: -4.0px;" />.
What will be an ideal response?
Mathematics
src="https://sciemce.com/media/4/ppg__rrrr0613190819__f1q110g5.jpg" alt="" style="vertical-align: -4.0px;" />.
What will be an ideal response?
Mathematics
You might also like to view...
Identify the number as rational or irrational.-9.851111 . . .
A. Irrational B. Rational
Mathematics
Find all horizontal asymptotes of the given function, if any.R(x) = 
A. y = 0 B. y = -11, y = 3 C. y = -3 D. no horizontal asymptotes
Mathematics
Simplify the complex fraction.
A. 
B. 
C. 
D. 
Mathematics
Write the system of linear equations represented by the augmented matrix. Then use back-substitution to solve. (Use variables x, y, and z.)

A. x = 35, y = -3, z = 1 B. x = 4, y = 1, z = 5 C. x = 1, y = -4, z = -5 D. x = 1, y = 4, z = 5 E. x = -4, y = 5, z = -1
Mathematics