The bar graph shows the number of students who flunk Dr. Jones' class each year. 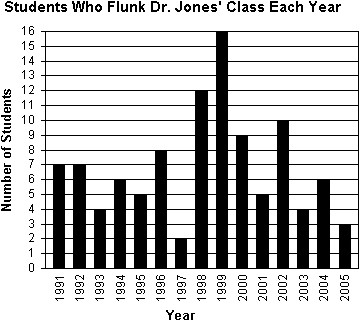 During which year did Dr. Jones' have the greatest number of students flunk his class? How many students flunked during that year?
A. 1998, 12 students
B. 1997, 2 students
C. 1998, 16 students
D. 1999, 16 students
Answer: D
You might also like to view...
State the property that is illustrated.3(6 ? 5) = (3 ? 6)5
A. commutative property of multiplication over addition B. associative property of multiplication C. identity property of multiplication D. distributive property of multiplication
Solve the problem.The stem and leaf plot depicts the debt-to-income ratios of loan applicants at a nearby bank. 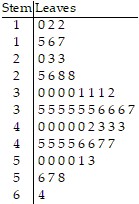 Units 6|4 = 64%Do more applicants have debt-to-income ratios in the 20's or 50's?
A. 20's B. 50's
For the given functions f and g, find the requested function.f(x) = 3x - 1; g(x) = 2x2 - 2Find (f + g)(5).
A. 66 B. 52 C. 62 D. 63
Solve the problem.After working for 25 years you would like to have  in an annuity for early retirement. If the annual interest rate is
  , compounded monthly, what will your monthly deposit need to be?
A. $1595.88 B. $797.94 C. $977.44 D. $2426.70