The figure below represents the effects in the labor markets due to migration. Here, the world has been divided into a high-income "North" (left panel) and a low-income "South" (right panel). Dn and Sn are the labor demand and the labor supply curves in North. Ds and (Sr + Smig) are the labor demand and pre-migration labor supply curves in South. Sr is the post-migration labor supply curve in South. The value c is the cost of migrating.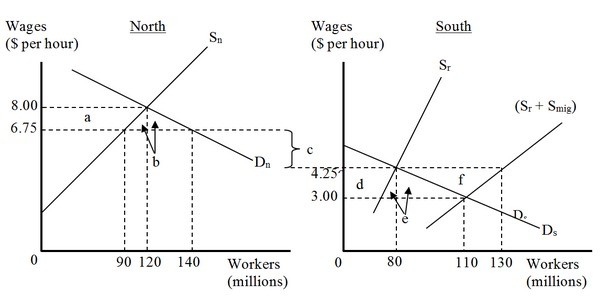 The net gain to the migrants is represented by the area
A. (a + f).
B. (e + f).
C. (d + e).
D. (a + b).
Answer: B
You might also like to view...
Even as the U.S. government ran large budget deficits in the early 2000s, the interest rate did not rise substantially. Which of the following is among the reasons that crowding out did not raise interest rates at that time?
A. The Federal Reserve decreased the money supply. B. The government spent the borrowed money in such a way that productivity, and therefore the availability of savings, dramatically increased. C. Americans increased their willingness to save at the same time that the budget deficits appeared. D. Foreigners were willing to finance the U.S. deficit with their abundant supply of savings.
Investment averages about ____ of GDP
a. 1/6 b. 1/8 c. 1/4 d. 1/2
The text suggests that foreign aid in the form of government-to-government assistance tends to create
What will be an ideal response?
For most firms, economic profit is:
a. less than accounting profit. b. equal to accounting proft c. greater than accounting profit. d. negative