The following table shows the number D, in millions, of DirecTV subscribers t years after 1995.
t 0 4 9 14 D 1.06 6.97 14.28 19.83?
?
A: Find the equation of the regression line.B: Plot the data along with the regression line.C: Based on the regression equation, how many new DirecTV subscribers would be expected over a 5-year period?D: What number of subscribers does the regression line predict for 2013?
What will be an ideal response?
A: 
?
B:
?
?
C: About 6.75 million
?
D: 25.72 million
Mathematics
You might also like to view...
Evaluate.-  ?
? 
A. - 
B. 
C. 
D. - 
Mathematics
Solve and graph.x ? 4 or x ? 7![]()
A. [-7, -4]![]()
B. (-?, 4] ? [7, ?)![]()
C. (4, 7)![]()
D. (-4, 7)![]()
Mathematics
Solve the triangle. 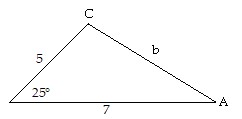
A. b = 2.25, A = 114.4°, C = 40.6° B. b = 3.25, A = 40.6°, C = 114.4° C. b = 3.25, A = 114.4°, C = 40.6° D. b = 4.25, A = 40.6°, C = 114.4°
Mathematics
Establish the identity.cot2  =
= 
What will be an ideal response?
Mathematics